THE STAT
Passer Rating and QBR Measure Different Things, and the Gap Is the Point
Fourteen desk1223 wordsQuarterbacks
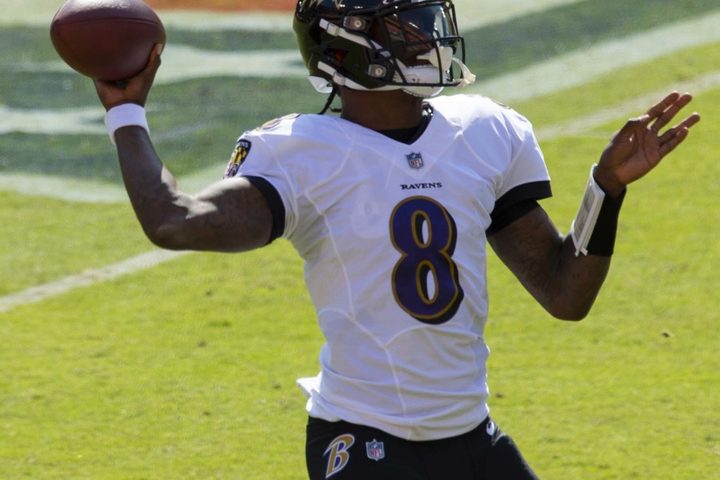
Foto: All-Pro Reels / Wikimedia Commons · CC BY-SA 2.0
The traditional NFL passer rating relies on a fixed box-score formula with four passing components, while ESPN's Total QBR evaluates performance through a play-by-play model adjusted for game context. When the two numbers tell conflicting stories about the same player on the same Sunday, they are not failing. They are evaluating two separate realities from two completely different sets of inputs.
Anyone looking at the qbr vs passer rating difference is looking at a divide between historical box-score accounting and situational play evaluation. The older metric looks purely at the final passing line in a standard box score. The newer system tries to measure how much an individual player contributed toward winning football games across all snaps taken under centre.
Fixed Box Scores and the 158.3 Ceiling
The formula for traditional passer rating is completely transparent, rigid, and strictly confined to passing attempts. Pro Football Reference shows the metric relies on four specific elements: completion percentage, yards per pass attempt, touchdown percentage, and interception percentage. The resulting calculation is bounded between zero and a maximum of 158.3.
Sporting News shows that the system requires only five raw inputs to calculate a score:
- Pass attempts
- Completed passes
- Total passing yards
- Touchdown passes
- Interceptions thrown
If an event does not appear in that exact list, the passer rating calculation ignores it. A quarterback can take eight sacks for a loss of sixty yards, drop three snaps, and fail to scramble on third down with open grass ahead, yet none of those actions will lower his passer rating by a single decimal point. A thirty-yard completion on third-and-twenty carries the exact same mathematical weight as a thirty-yard completion on third-and-two. A screen pass that a running back carries fifty yards to the end zone is credited entirely to the quarterback's passing volume in the traditional formula, just as if the ball had traveled fifty yards through the air into double coverage.
Because the system treats every yard and completion identically regardless of the situation, the scale creates familiar distortions. It rewards raw per-attempt passing production without evaluating whether that production occurred during competitive drives or in garbage time against prevent defense.
Expected Points, Down and Distance in Total QBR
ESPN introduced its Total QBR formula in August 2011 following an analysis of 60,000 plays spanning three seasons. Rather than relying on a 158.3-point ceiling, the metric maps results to an index scale ranging from 0 to 100. A score of 50 represents average performance across the league.
The foundational engine of Total QBR is expected points added per play. ESPN explains that the model evaluates each snap based on down, distance to the first down marker, field position, remaining clock, and score differential. A two-yard completion on third-and-three in the fourth quarter of a one-possession game creates positive expected points added. The identical two-yard completion on third-and-eighteen produces negative expected points, because punting remains the expected outcome on the next down.
ESPN states that its metric assigns direct credit or blame to the quarterback for every snap involving him, weighting each play by its importance to the outcome of the game. A turnover in the final two minutes of a tied contest alters expected win probability far more heavily than an interception thrown while trailing by 28 points midway through the fourth quarter.
Why Rushing, Sacks and Game State Split the Two Metrics
The widest disagreements between the two metrics happen when a quarterback generates value or commits mistakes outside of pure throwing attempts. The traditional rating tracks only passes that leave the hand. Total QBR incorporates nearly every event an offensive signal-caller can produce.
ESPN says QBR tracks and grades:
- Completions and incompletions
- Passing interceptions and interception returns
- Quarterback sacks absorbed
- Fumbles and fumble recoveries
- Quarterback scrambles and designed running plays
- Defensive pass interference penalties drawn
This inclusion list explains why dual-threat passers and sack-prone pocket passers frequently produce jarring rating splits. A quarterback who throws for 190 yards, one touchdown, and no interceptions might record a modest passer rating around 85.0. If that same player added 65 rushing yards on five critical third-down conversions, took zero sacks, and drew two defensive pass interference penalties for 40 hidden yards, ESPN's model awards credit for all of those positive outcomes, pushing his QBR significantly higher.
Conversely, a passer can compile 320 passing yards and two touchdowns to secure a traditional rating above 105.0 while actively hurting his offense. If those 320 yards came alongside four drive-killing sacks, two lost fumbles, and 120 passing yards accumulated after falling behind by three scores, Total QBR penalizes the sacks and turnovers while discounting the late-game yardage against soft coverage. The resulting QBR can sink into the 30s or 40s. One metric recorded the raw box score; the other evaluated the cumulative point swings of each snap.
Separating Passer From Receiver on Air Yards and Run After Catch
A chronic flaw in standard box-score stats is the inability to distinguish between the throw and the catch. If a quarterback throws a five-yard slant and the wide receiver breaks three tackles to gain 75 yards, the box score hands 80 passing yards to the quarterback.
ESPN addressed this distribution in technical explainers for its metric. The network states that QBR assigns credit on completions by separating the air distance of the throw from the subsequent yards gained after the catch.
The QBR system establishes an expected baseline for yards after catch on any given completion. It then compares the actual outcome to that expectation. When a receiver takes a short dump-off and generates 40 unexpected yards through individual effort, the receiver receives the bulk of the play's expected points value, while the quarterback receives credit only for completing an open checkdown. If a quarterback delivers an accurate 35-yard strike downfield into tight coverage where zero run after catch is possible, the model awards the lion's share of the positive value directly to the passer.
ESPN says its framework attempts to isolate the points a quarterback is personally responsible for, distilling his contributions away from the offensive teammates around him.
Formula Openness and the Limits of Play-by-Play Tracking
Understanding what each metric measures reveals what to use them for. Traditional passer rating is an open formula. Anyone with an internet connection, a basic calculator, and a final box score can compute a player's rating within sixty seconds. The math never changes, the inputs are standard across every historical era, and there are no proprietary judgment calls built into the calculation. The trade-off is extreme narrowness: it ignores running, ignores sacks, ignores penalties, and treats every yard as equal regardless of the game clock.
Total QBR captures real-world game flow far more accurately by modeling expected points, contextual leverage, defensive penalties, and rushing contributions. The trade-off sits on the transparency side. While ESPN has published extensive documentation regarding its inputs, 60,000-play baseline, and statistical philosophy, outside researchers cannot independently calculate an exact QBR from a standard stat sheet without access to ESPN's internal tracking data and point-assignment models.
When one number rates a quarterback near the top of the league while the other places him in the bottom third, neither number is lying. The passer rating tells you how clean his raw throwing box score looked. Total QBR tells you how much his total snaps, scrambles, sacks, and contextual plays moved the scoreboard.